Release Note for LAMOST DR5
1.Statistical Analyses of Parameters for LAMOST DR5
LAMOST DR5 data were released to domestic users in December of 2017. We present the distributions of parameters for DR5, and compare this version with the previous versions. The results are shown as follows. Additionally, we abbreviate the initial DR4 as “dr4_v1”, and the revised DR4 as “dr4_v2”.
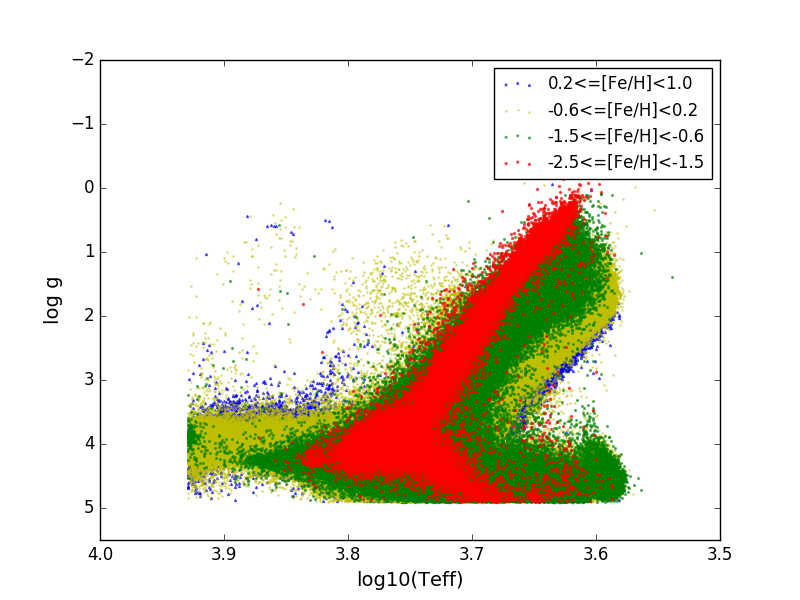
1.1 Distributions of Atmospherical Parameters (Teff, logg, [Fe/H]) and Radial Velocity (rv).
The atmospherical parameter space of DR5 is shown as follows. Metallicity bins are represented by different colors.
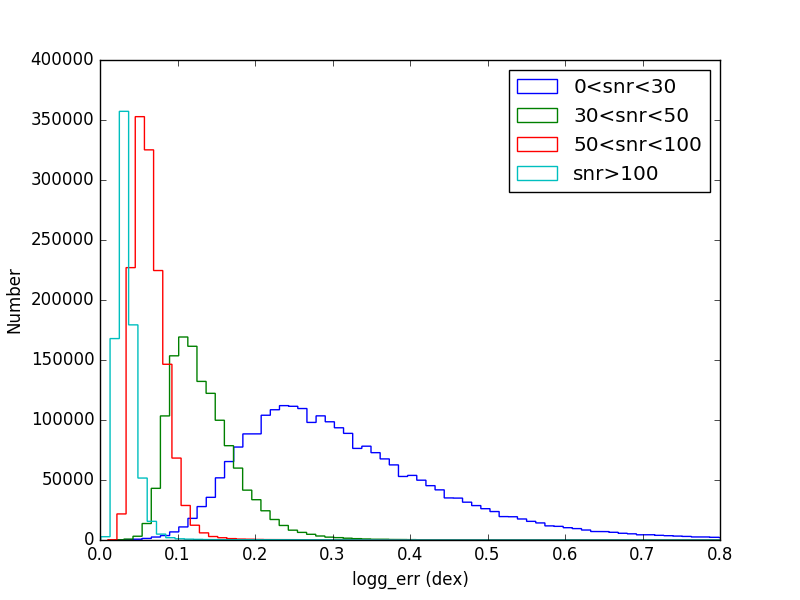
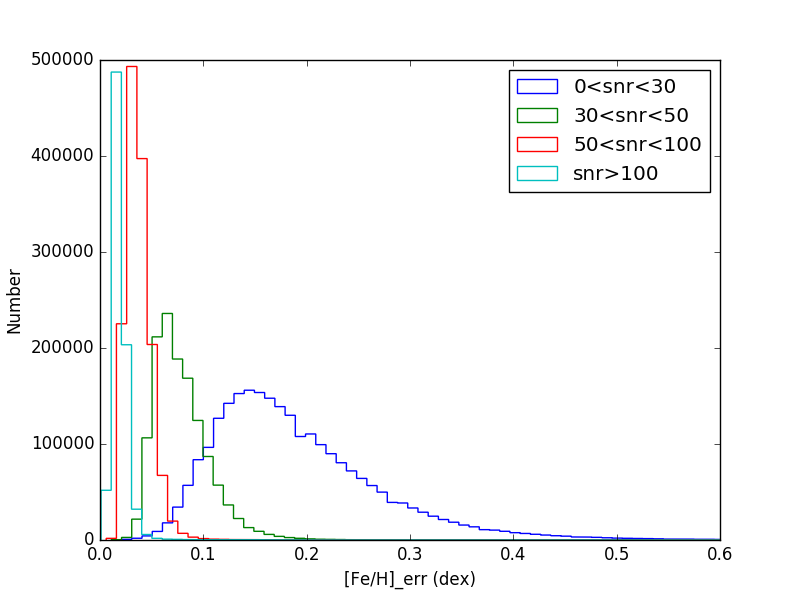
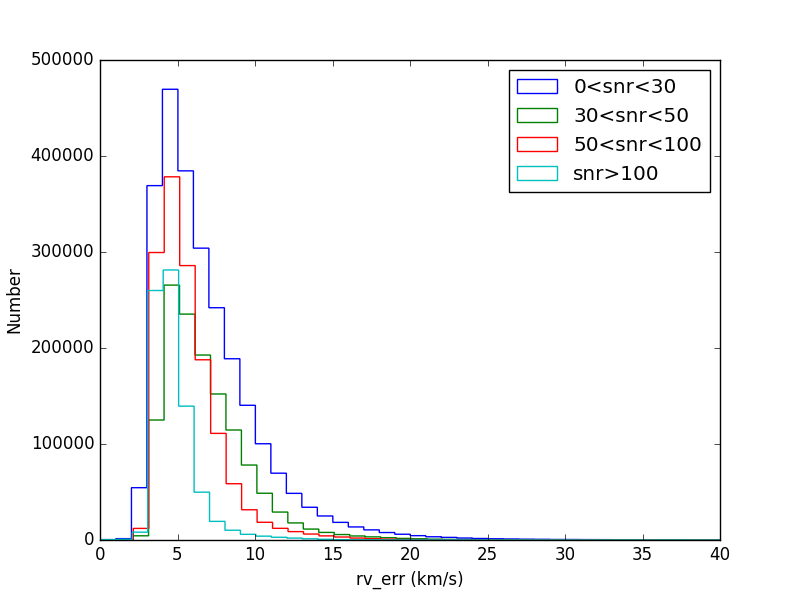
The following diagrams show the distributions of errors of atmospherical parameters (Teff, logg, [Fe/H]) as well as rv in different SNR of r band (snr)) bins.
 |
 |
 |
|
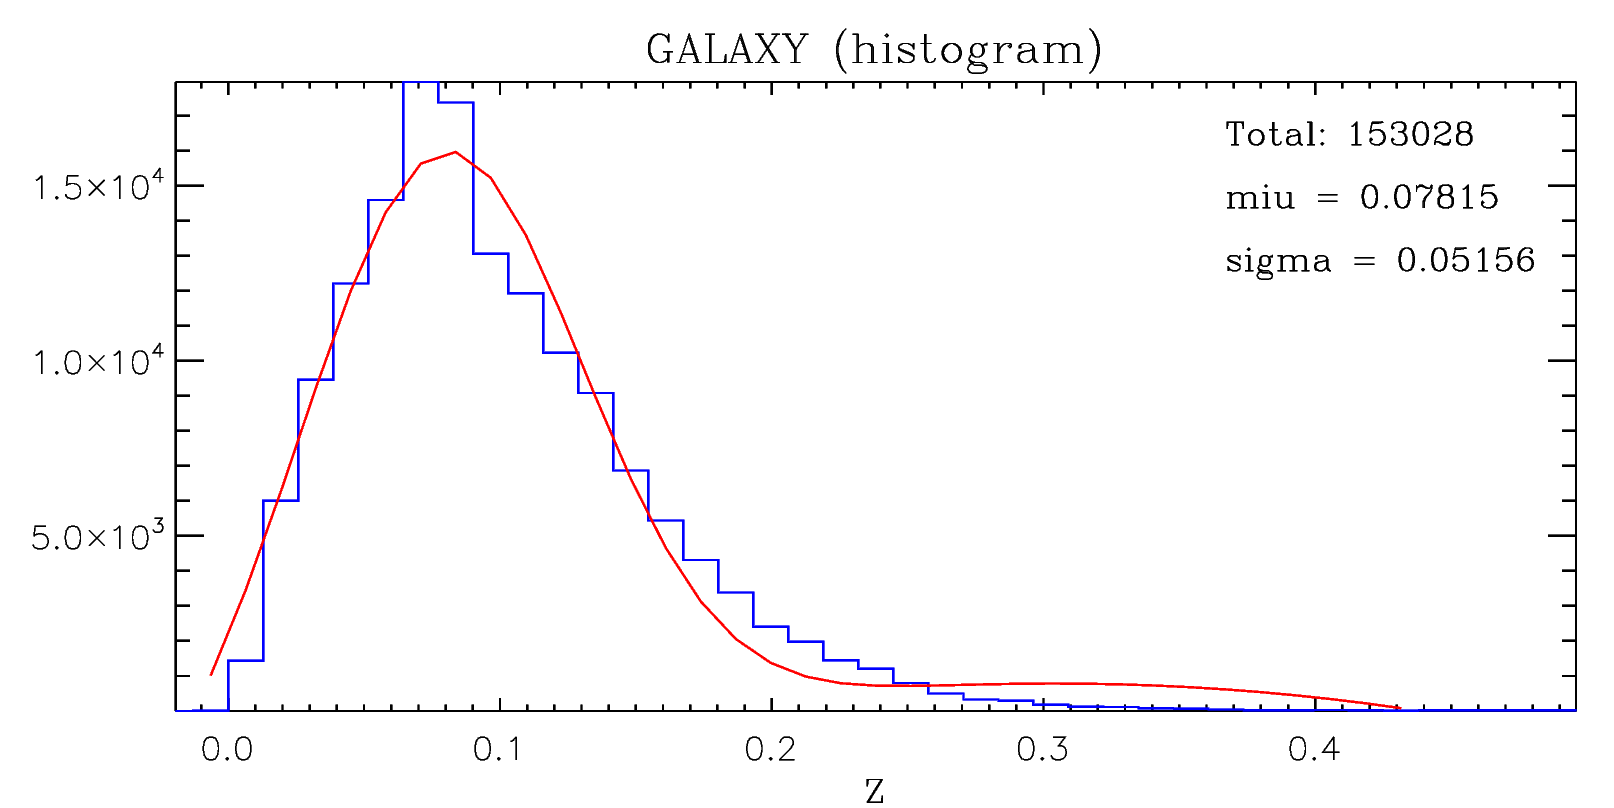
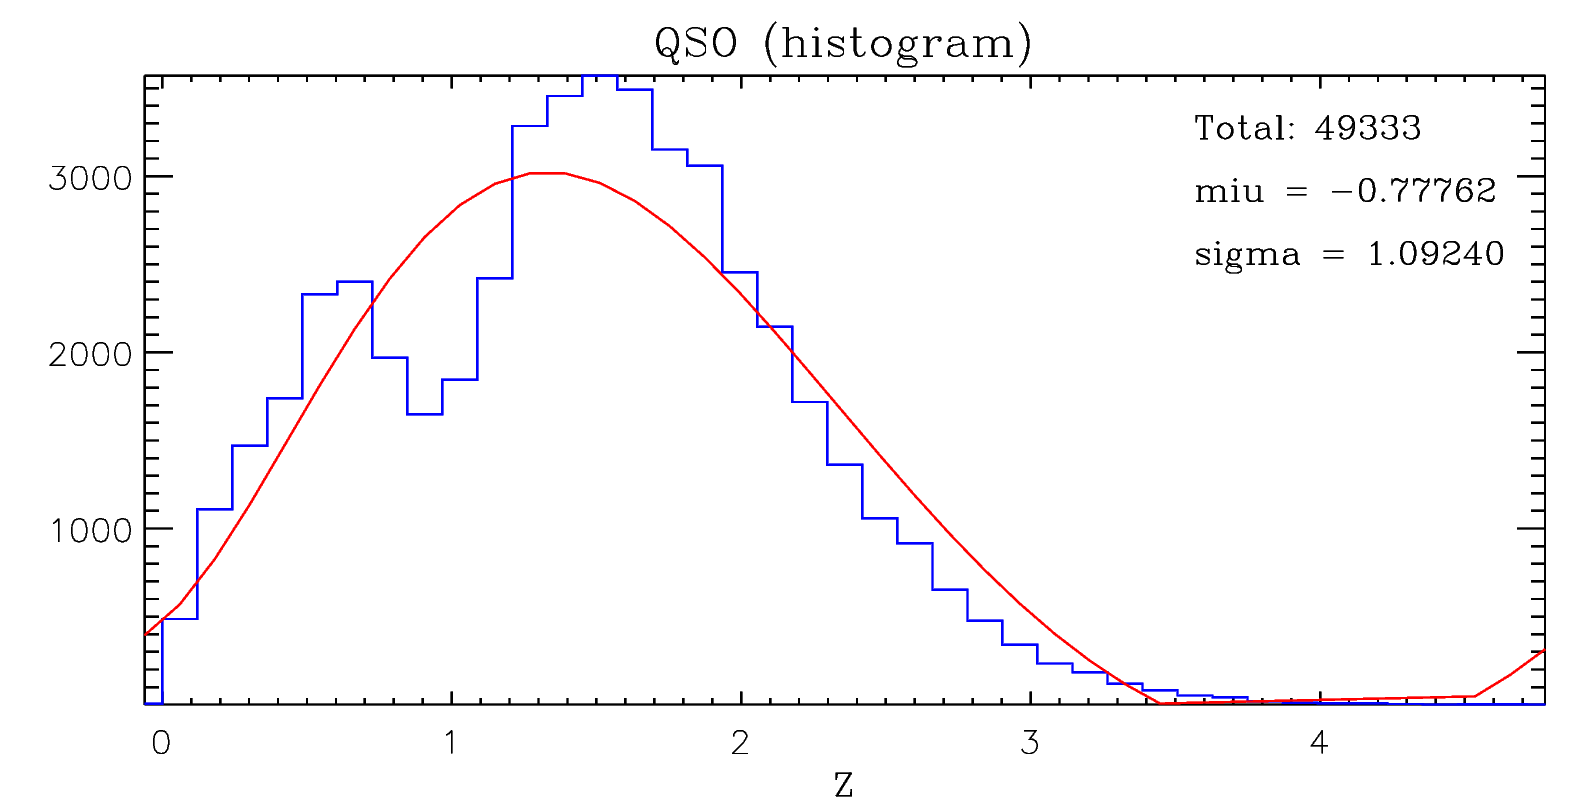
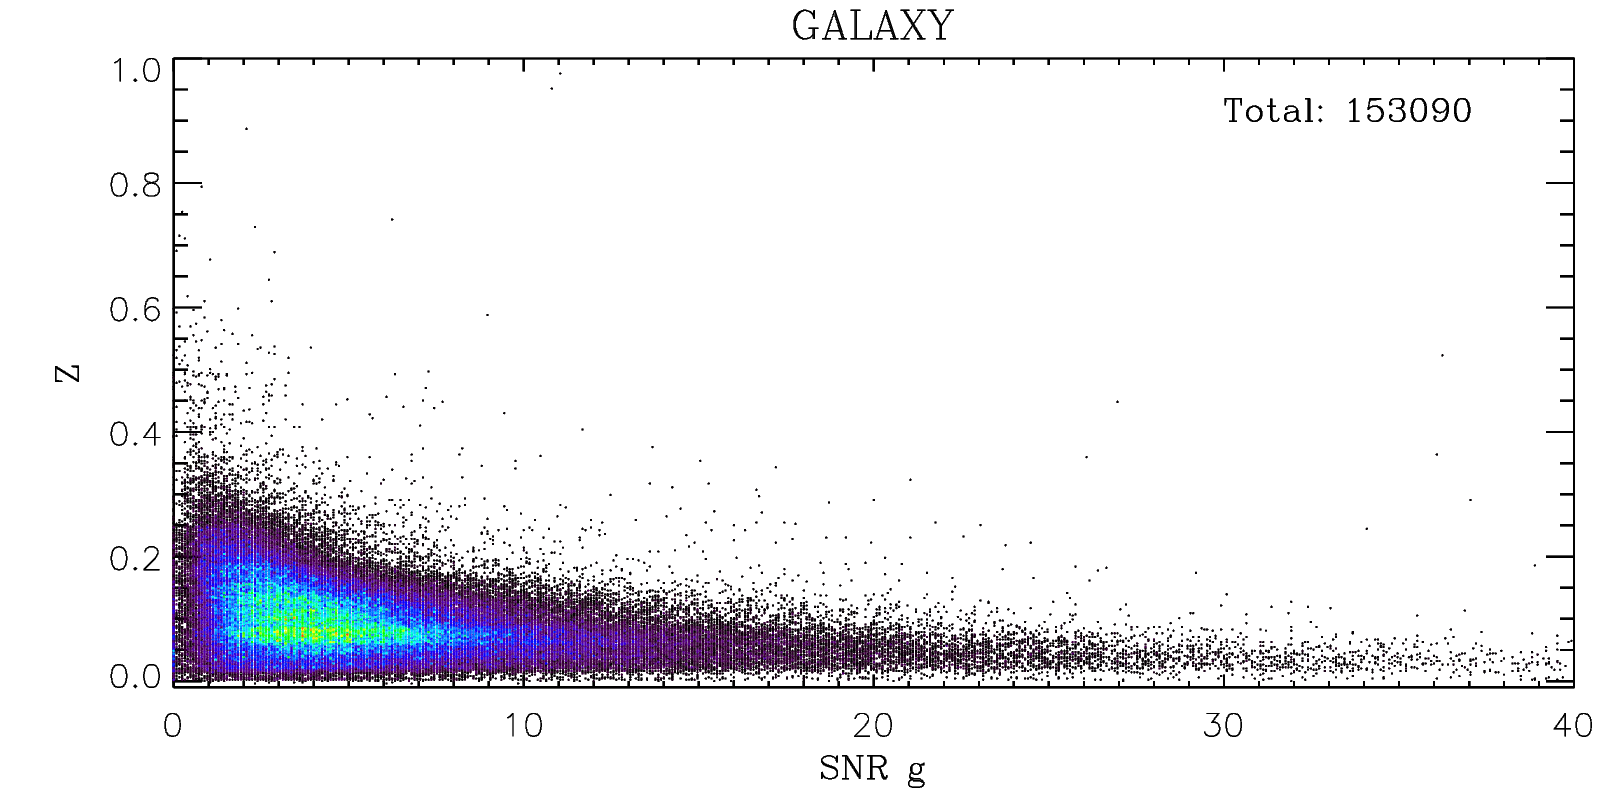
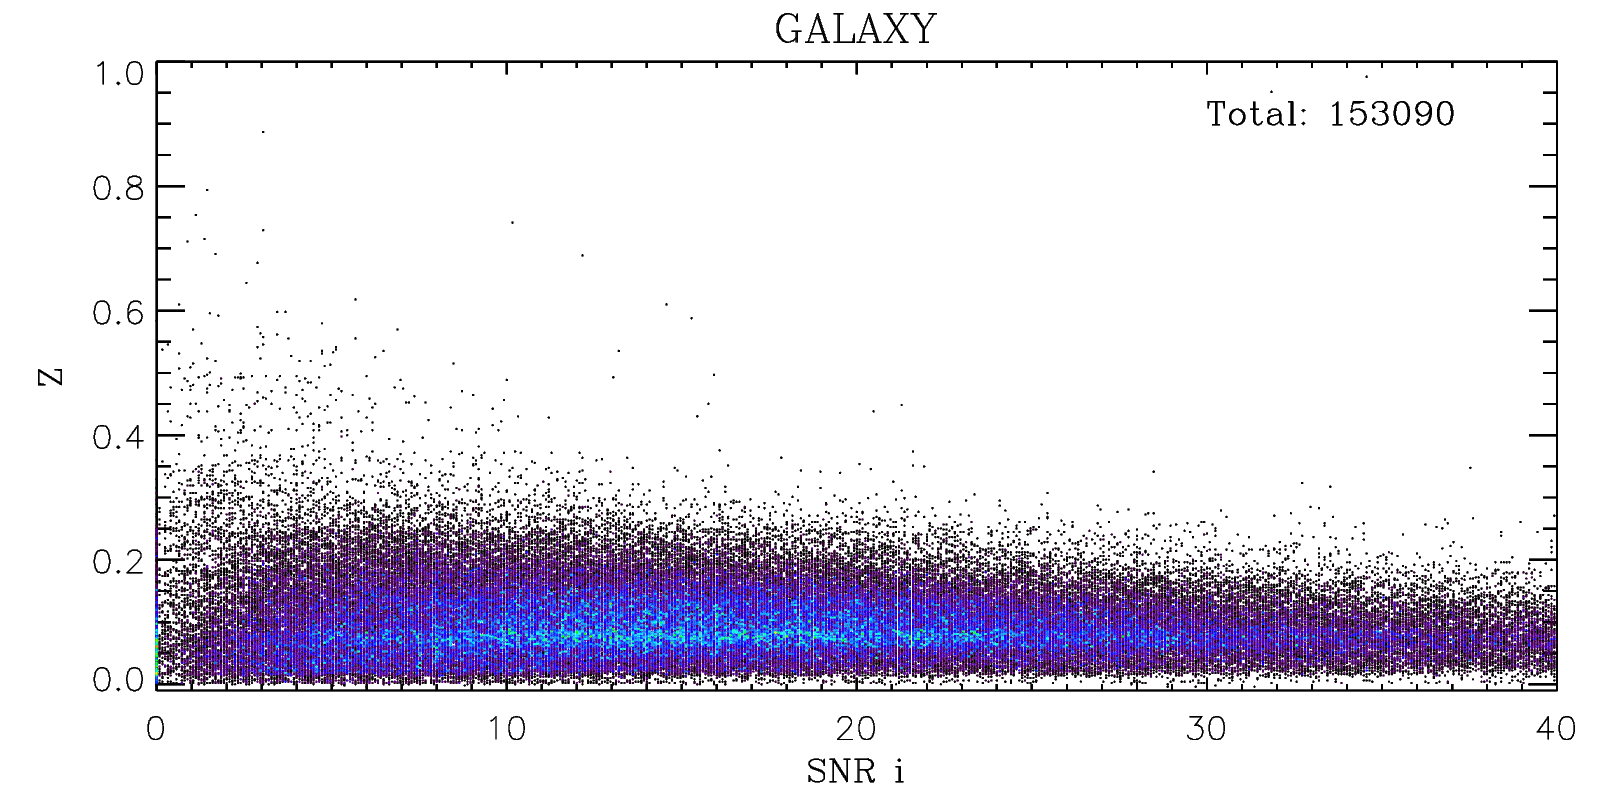
1.2 Distributions of Redshifts for galaxy and QSO
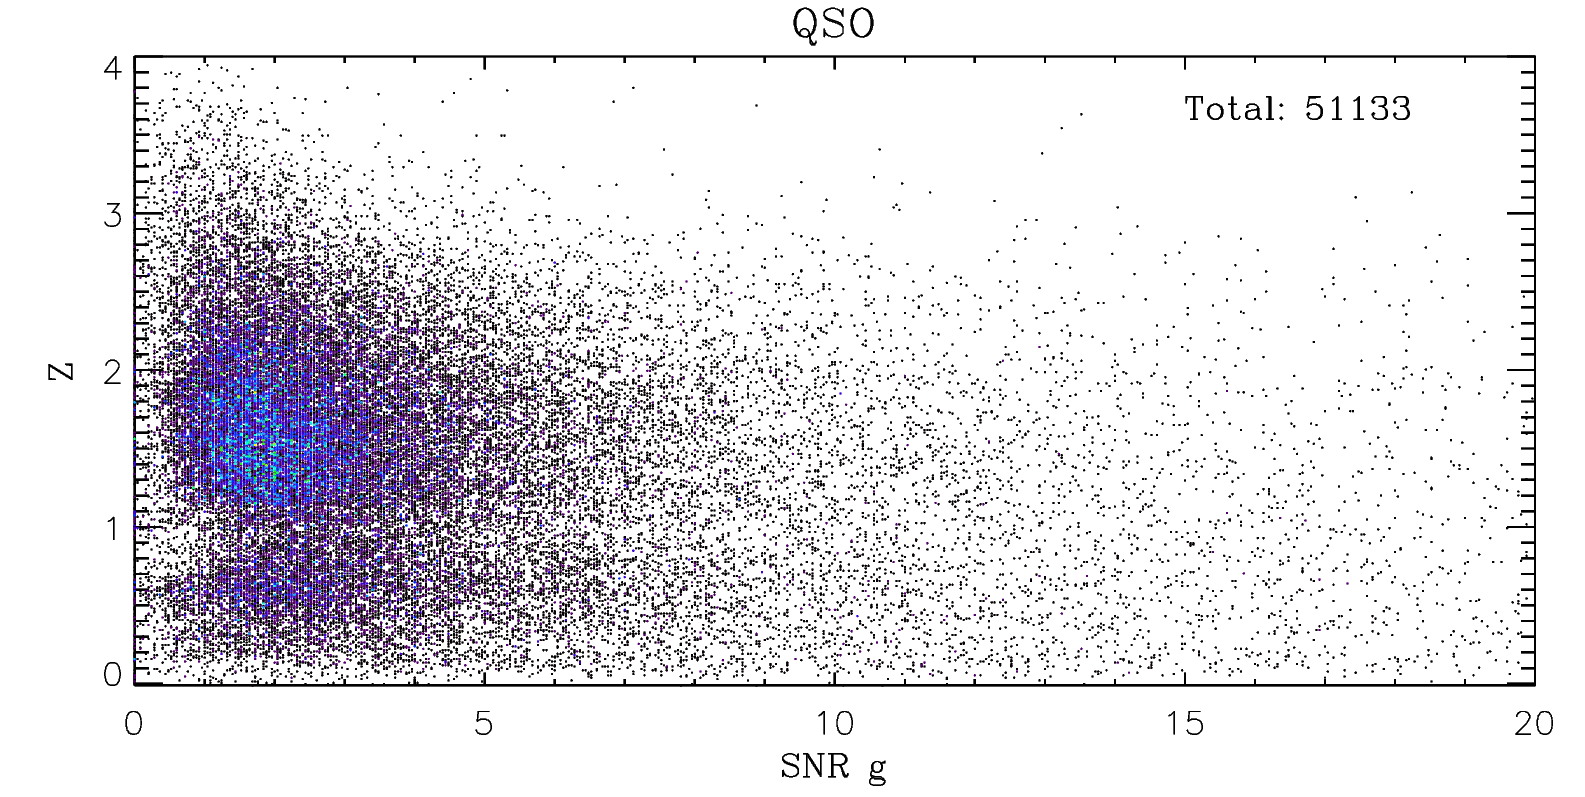
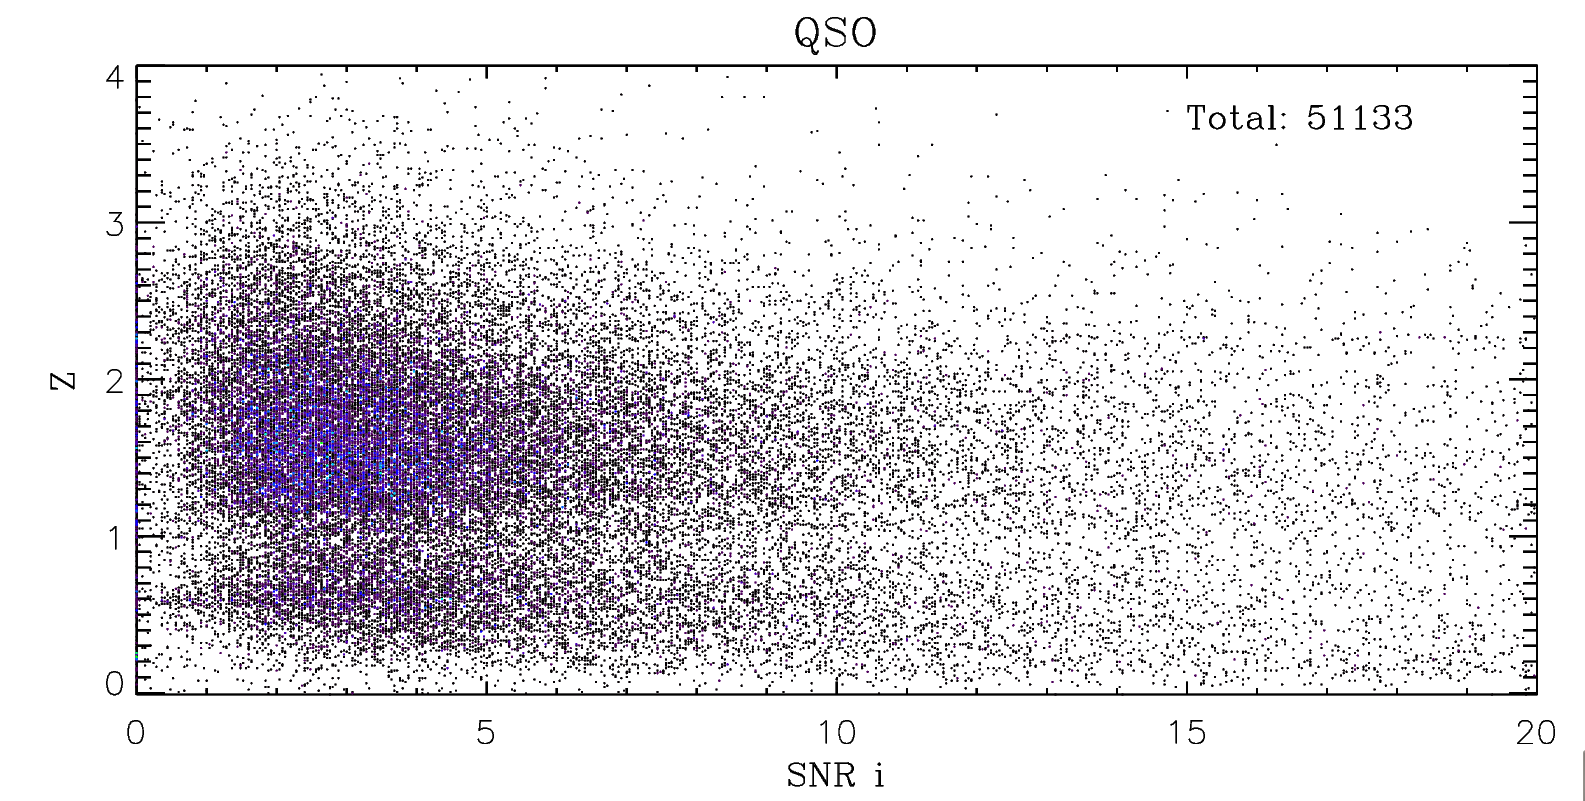
The histograms of redshifts for galaxies and QSOs are shown in the following figures. Besides, we also present the variations of redshifts with SNR of g band (sng) or i band (sni). In the figures, there is a gap lying at the redshift about 1.0 for QSOs, which is also shown in the figures of Z versurs sng/sni. The reason is that the spectral line of Mg II with redshift about 1.0 are often confused with the conjection of the two spectrum arms. To avoid mistaking the bad conjection as Mg II line of QSO, the pipeline and following eyecheck are apt to refuse such spectra as QSO, which results in the missing of some true QSO spectra with redshift about 1.0.
 |
 |
 |
|
 |
|
2.The Parameter Comparisons between DR5 and dr4_v1
We select targets which have both DR5 and dr4_v1 parameters, and compare their atmospheric parameters (Teff, logg, [Fe/H]) and rv of the two versions in following figure. The average values and standard deviations of differences of the two versions are also shown in the figure.
From the upper left panel of the figure, we can see that there is a vertical substructure around Teff_dr4_v1 = 4500 K and a horizontal substructure around Teff_dr5 = 4500 K. The number of stars in two substructures is less than 500, and most of their sng are less than 10. We manually checked those spectra in DR5 and DR4, and found that almost all of them have low quality, and relatively worse in DR4. Most of those low sng spectra have similar continuum shapes and noise pattern, which might be the reason of the two substructures.

The histograms of the differences between DR5 and dr4_v1 for atmospherical parameters (Teff, logg, [Fe/H]) and rv are shown as follows. The differences of parameters are divided into four groups according to the snr, represented by different colors. We can see that the scatters of atmospherical parameters in the bin of 0<snr<30 are obviously larger than other bins.

3.The Parameter Comparisons between DR5 and DR3
We select targets which have both DR5 and DR3 parameters, and compare their atmospheric parameters (Teff, logg, [Fe/H]) and rv the two versions in following figure. The average values and standard deviations of differences of the two versions were also shown in the figures.

The histograms of the differences between DR5 and DR3 for atmospherical parameters (Teff, logg, [Fe/H]) and rv are shown as follows. The differences of parameters are divided into four groups according to the snr, presented by different colors.

4.The Parameter Comparisons between DR5 and SDSS
The difference of parameters between LAMOST DR5 and SDSS (DR14 and APOGEE) are shown in this section.
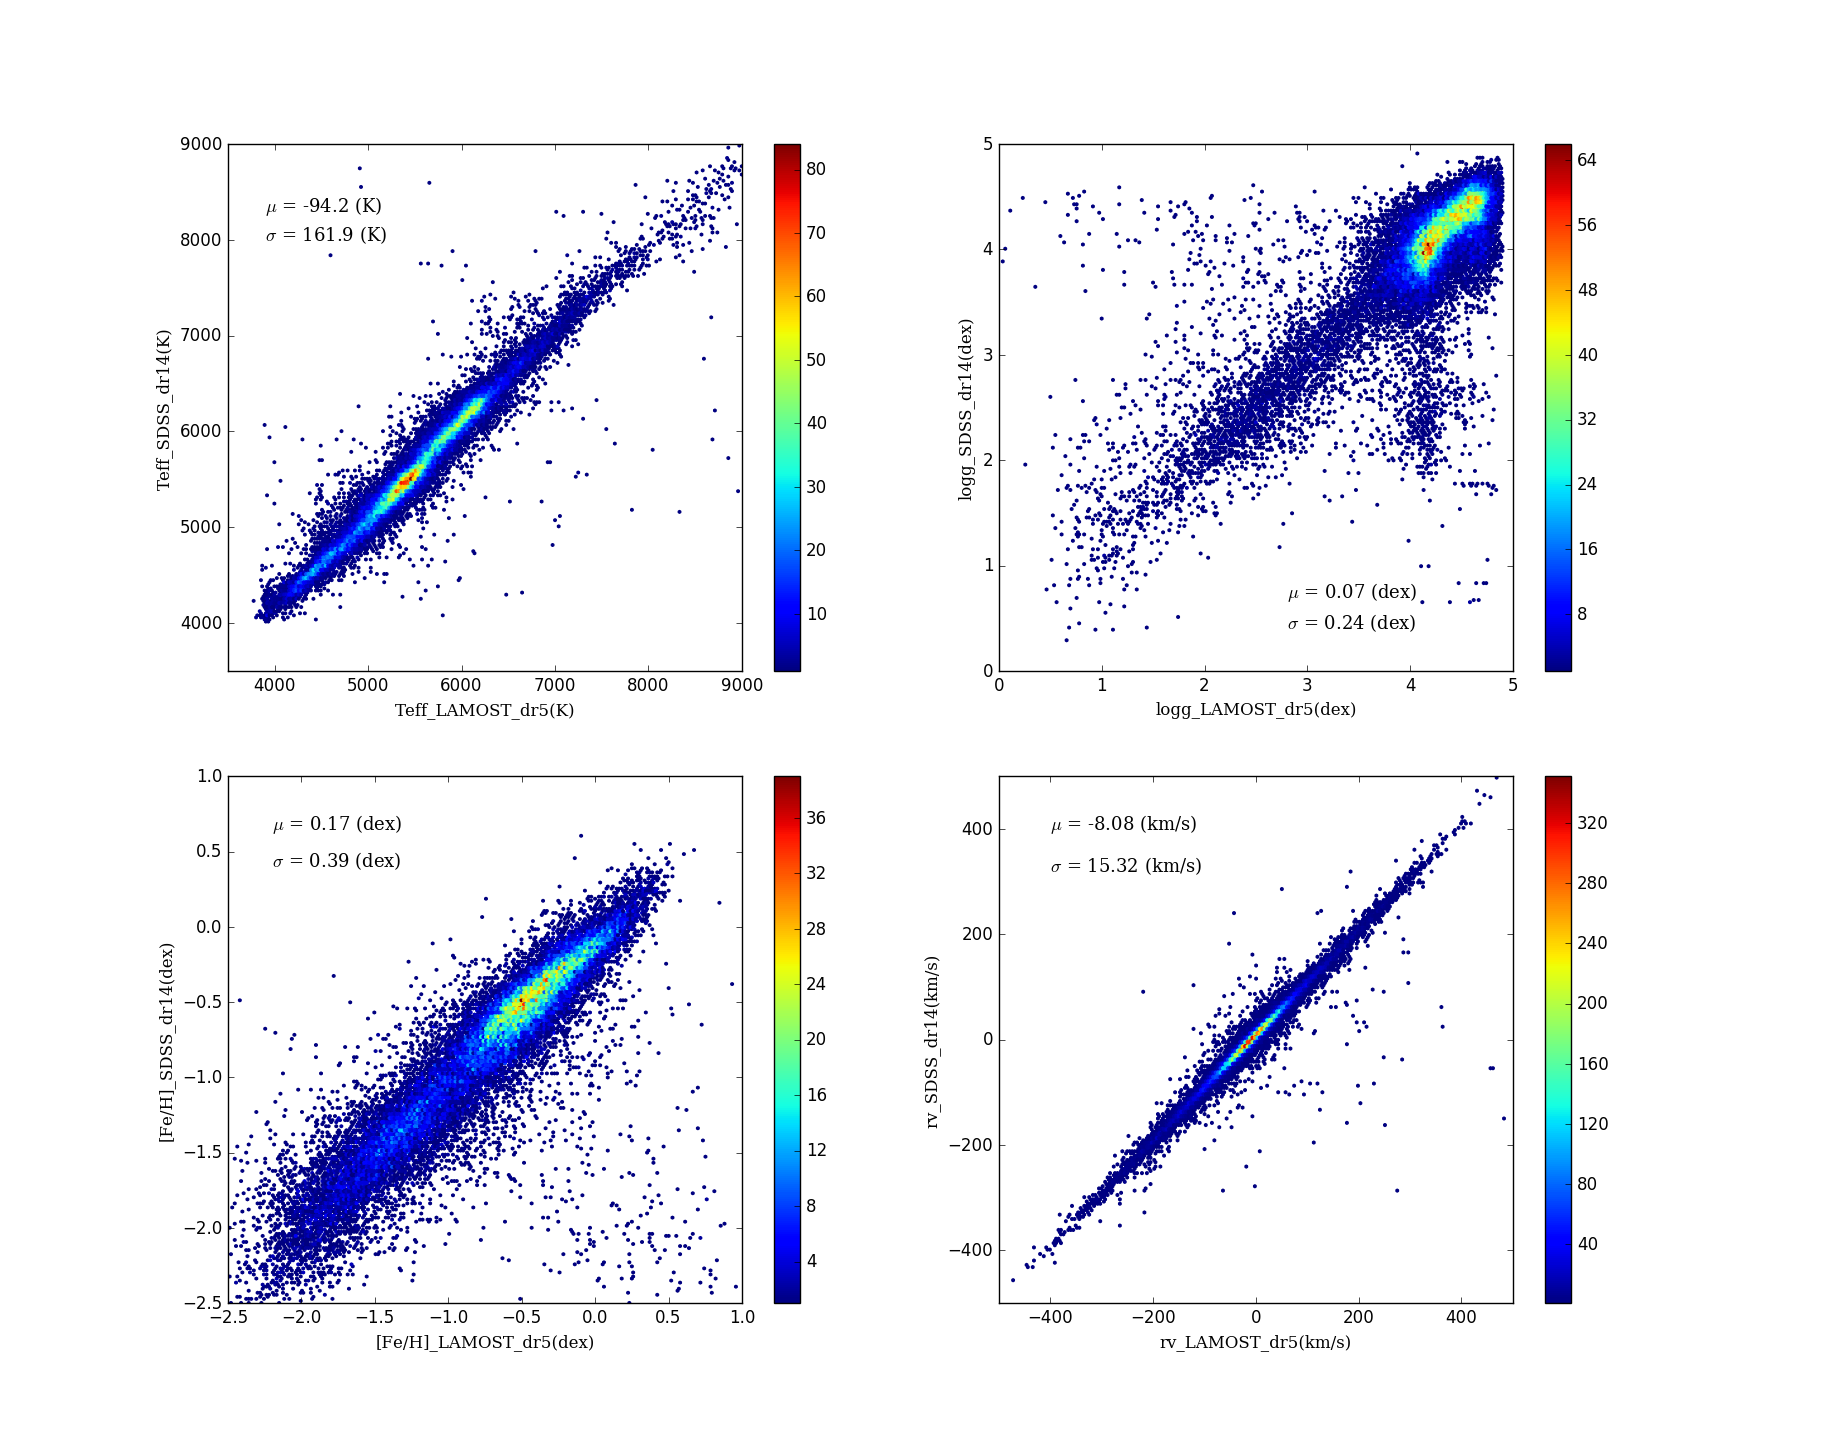
(1). The following figures show the comparisons of atmospherical parameters (Teff, logg, [Fe/H]) as well as rv between LAMOST DR5 and SDSS DR14. For the parameters of logg, a branch is seen in the bottom-right of the top-right panel. It could be explained by the inhomogeneous distribution of the atmospherical parameters for the ELODIE library. There are holes for giants in the ELODIE library, making the estimations of the initial guess for atmospherical parameters in the giant holes inaccurate.
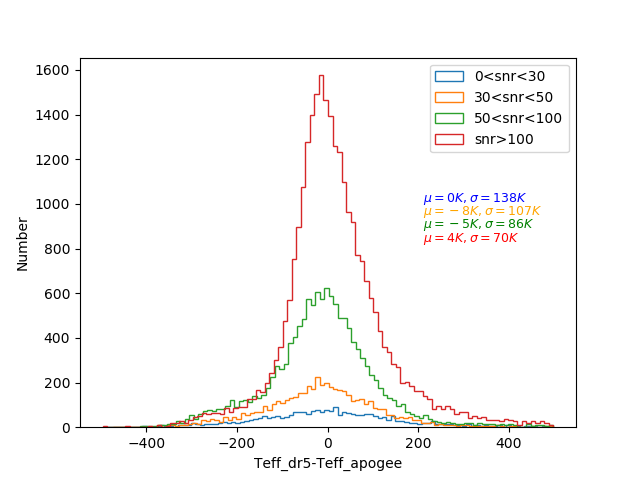
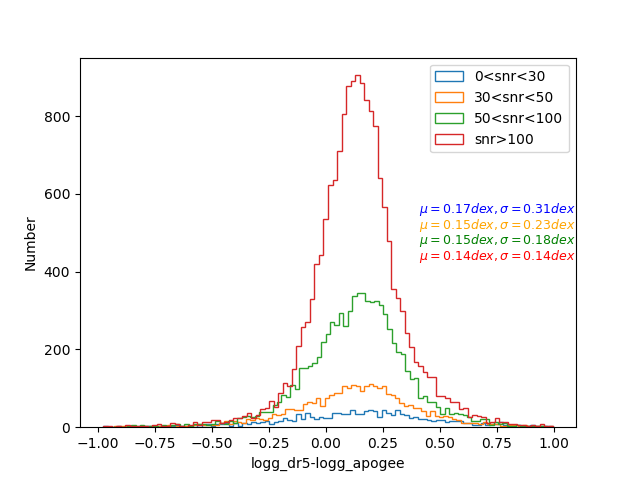
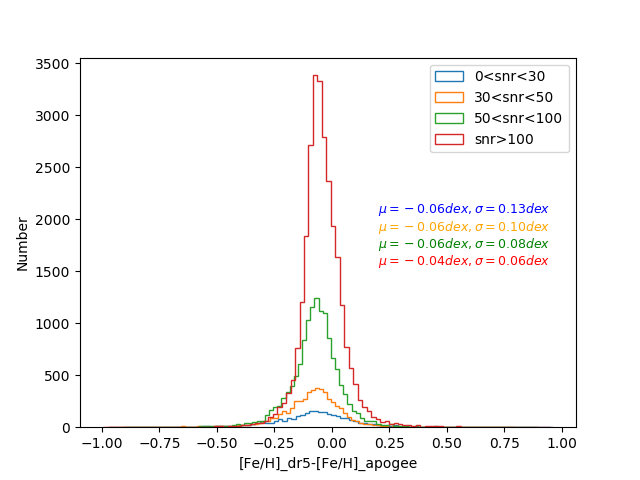
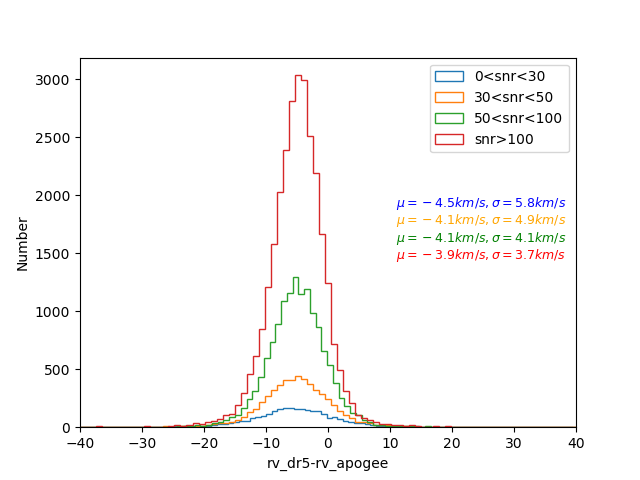
(2). The histograms of the differences of atmospherical parameters (Teff, logg, [Fe/H]) as well as rv between LAMOST DR5 and APOGEE are provided as follows. In comparison with APOGEE, the differences of parameters are divided into four groups according to snr. We also plot the mean values and the standard deviations corresponding to each snr bin in the figures.
 |
 |
 |
|