The single exposure date for the general catalog in LAMOST DR5, including the data observed from October 2011 to June 2017, are released. Spectra in FITs format can be downloaded here. All files, in FITS format, are distributed in the sub-directories of DATE and PLANID, where DATE denotes the observation date and PLANID denotes the name of the observed plate. Spectrum of individual exposures in the same observation are wrapped in the same file. For example, file "20111024/F5902/20111024_F5902_01_001.fit" contains all the sub-exposure flux and the information of the first fiber of the first spectrograph in the planid of "F5902" taken on Oct 24th, 2011. The header of each file contains the information of the observation, the instruments and the data reduction, etc.
Each file contains 3 ASCII table extensions. The first extension contains the spectrum data structure, described as follows:
| flux: | flux, an array with the size of 4136*n, where n is the number of individual frame. Usually n is twice the number of exposures including the red and blue branch of the spectrum, but there are rare cases that one part of the spectrum fails, then users should reference color and mjm to know which part is lost. The flux is the photon counts per pixel. |
| invvar: | invert variance, an array with the size of 4136*n. |
| loglam: | log-lambda, an array with the size of 4136*n. The wavelengths are in vacuum scale and heliocentric frame. |
| pixelmask: | pixel mask, an array with the size of 4136*n. Each element is an integer in the same usage as 'andmask' and 'ormask' described in the docoments of Data Release 7. |
| skyflux: | subtracted sky flux, an array with the size of 4136*n. |
| fluxcorr: | relative flux calibration curve, an array with the size of 4136*n. |
| mjm: | the number of minutes elapsed from 0:00 Nov 17th 1858 Beijing time to the beginning of the exposure, an array with the size of n. |
| color: | branch, b or r branch, an array with the size of n. |
| exptime: | exposure duration time, an array with the size of n. |
| fibermask: | fiber mask, an array with the size of n. Each element is an integer in the same usage as 'FIBERMAS' described in the docoments of Data Release 7. |
The second and the third extensions contain information of arc lines in the blue and red branches, respectively. The arc line information is useful to determine the line profile caused by the instrument. The structure of each extension is:
| line: | the wavelength of used arc lamp lines, in angstrom |
| xarc: | the pixel position of the line centers in the raw image, in pixel |
| width: | the FWHM of the lines, in angstrom |
| inten: | the intensity of the lines, in counts |
| werror: | the wavelength error, in angstrom |
In addition to the spectra data in FITS format, there are three catalogs: catalog of repeated observations, catalog of radial velocity (RV), catalog of spectral line equivalent width (EW). The catalogs can be queried here via web page, or downloaded from the links listed below.
The catalogue contains 3 tables: reobsstat (Sample, Full CSV) gives information of repeated observations of individual targets; sexprv (Sample, Full CSV) shows the RV of single exposure spectra, lineindices (Sample, Full CSV) shows the information of all spectral lines in single exposure spectra.
| Column | Description | Comment |
| gid | unique source ID | The targets within 3 arcsecond are considered to be the same source. |
| nobs | number of co-added spectra | |
| nexp | number of exposures | |
| tra | right ascension, in degree | This is the median value of right ascension in the input catalogue for this source. |
| tdec | declination, in degree | This is the median value of declination in the input catalogue for this source. |
| nrv | number of RV measurements | Only the RV obtained from the single exposure spectra is taken into account. RV from spectra with S/N ratio for both g band and i band less than 10, or nabsline (described in table sexprv) equal to 0 are not counted. |
| maxrvdif | maximum difference of RV, in km/s | Same as above. |
| rvmean | average RV, in km/s | Same as above. |
| rvsigma | RV deviation, in km/s | Same as above. |
| subclass | sub-classification | the most frequent subclass in DR5 general catalogue |
| teff | efficient temperature, in K | the median value of teff in DR5 parameter catalogue |
| logg | surface gravity, in dex | the median value of logg in DR5 parameter catalogue |
| feh | metallicity, in dex | the median value of feh in DR5 parameter catalogue |
| Column | Description | Comment |
| specid | spectra ID | Combination of obsdate, planid, spid and fiberid |
| obsdate | date of the observation | |
| planid | plan ID | |
| spid | spectrograph ID, 01~16 | |
| fiberid | fiber ID, 001~250 | |
| iexp | exposure ID, 0~nexp | |
| mjm | modified Julian minute | mjm means the number of minutes elapsed from 0:00 Nov 17th 1858 Beijing time. |
| sng | average S/N ratio of g band | |
| sni | average S/N ratio of i band | |
| subclass | sub-classification from DR5 general catalog | |
| rv | RV, in km/s | |
| rverr | error of RV, in km/s | |
| rvpa | RV from DR5 parameter catalog, in km/s | |
| teff | effective temperature from DR5 parameter catalog, in K | |
| logg | surface gravity from DR5 parameter catalog, in dex | |
| feh | metallicity from DR5 parameter catalog, in dex | |
| minchi2 | minimum value of reduced χ2 between the spectrum and the template | |
| npix | number of pixels involved in calculation | Sky emission lines, telluric bands, DiB lines, and bands with low S/N are masked in calculation. |
| nabsline | number of absorption lines in the spectrum | |
| fratio | flux ratio to the stronger adjacent fiber | The higher the value, the more likely the spectrum is polluted. |
| fratio_b | same as above, but for blue branch only | Same as above. |
| fratio_r | same as above, but for red branch only | Same as above. |
| obsid | obsid in DR5 general catalog | |
| designation | designation | Same as designation in DR5 general catalog. |
| gid | unique source ID | Same as gid in table reobsstat. |
| ra | right ascension, in degree | Same as ra in DR5 general catalog. |
| dec | declination, in degree | Same as dec in DR5 general catalog. |
| spec | spectra ID in another format | Same as the filename of co-added spectra, in format of 'spec-lmjd-planid-spspid-fiberid'. |
| filename | file name of corresponding spectrum |
| Column | Description | Comment |
| specid | spectra ID | Combination of obsdate, planid, spid and fiberid, same as specid in table sexprv. |
| iexp | exposure ID, 0~nexp | |
| mjm | modified Julian minute | Same as mjm in table sexprv. |
| line | line ID | integer, round value of its rest wavelength in air, e.g. 6563 |
| lambda | rest wavelength in air, in angstrom | |
| x_min | lower bound of fitting range, in angstrom | |
| x_max | upper bound of fitting range, in angstrom | |
| blend | mark of blend lines | 1 for blend and 0 for single |
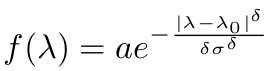
| intensity | line intensity | This is the intensity of normalized spectrum and is dimensionless. Together with the three following items are parameters of a single line or the first component if the line is blended. |
| center | line center, in angstrom | |
| param_c | parameter σ | dimensionless |
| param_d | parameter δ | dimensionless |
| intensity1 | line intensity of the 2nd component | This is the intensity of normalized spectrum and is dimensionless. Together with the three following items are parameters of the second component if the line is blended. 0 means the line is single. |
| center1 | line center of the 2nd component, in angstrom | 0 means the line is single. |
| param_c1 | parameter σ of the 2nd component | dimensionless, 0 means the line is single. |
| param_d1 | parameter δ of the 2nd component | dimensionless, 0 means the line is single. |
| fwhm | full width at half maximum, in angstrom | |
| fwhmerr | error of FWHM, in angstrom | |
| few | EW of fitted function, in angstrom | |
| fewerr | error of FEW, in angstrom | |
| ew | EW, in angstrom | |
| ewerr | error of EW, in angstrom | |
| chi2 | χ2 between spectra and fitted function | |
| cc | correlation between spectra and fitted function | |
| obsid | obsid in DR5 general catalog | Same as obsid in table sexprv. |
| designation | designation | Same as designation in DR5 general catalog. |
| ra | right ascension, in degree | Same as ra in DR5 general catalog. |
| dec | declination, in degree | Same as dec in DR5 general catalog. |
| spec | spectra ID in another format | Same as spec in table sexprv. |
| gid | unique source ID | Same as gid in table reobsstat. |
If you want to query a large number of results, the best way is to download all the catalogues and then write your own programs. Alternatively, you can refer to the following examples to get the results you want.
■ Query the repeated observation of a target according to the coordinates.
Select options in Position Constraints, then click Submit.
■ Query the targets who have more than 5 exposure times and the maximum change of RV greater than 10 km/s.
In Position Constraints, select None. In Options, click Search only in this table of table reobsstat, set min of nexp to 5, min of maxrvdif to 10, then click Submit.
■ Query the targets who have more than 5 exposure times and the maximum RV change greater than 10 km/s and display their RV values.
In Position Constraints, select None. In Options, set min of nexp to 5 and min of maxrvdif to 10 for table reobsstat, then click Submit.
■ Query the RV results according to the coordinates.
Select options in Position Constraints, then click Search only in this table of table sexprv in Options. Click Submit.
■ Query EW of all lines for a given specid.
Click Search only in this table of table lineindices in Options, then input your specid. Click Submit.
■ Query all emission Hα lines.
Click Search only in this table of table lineindices in Options, set min of intensity to 0, then click Submit.